
Zach Watson
Wireframes are often the starting point for screen design.
Wireframes are the first visualization of your user research. They translate the insight you’ve gained from user research into blueprints for the user experience and interface.
Wireframes are the ideal medium for getting feedback from users and stakeholders when they're kept at low fidelity. The blueprint-esque visuals take less time to change, so you can rapidly evolve your design vision before the details become too complex.
Despite playing a critical role in the UX design process, wireframes aren’t always easy to create. Giving your user research a visual form requires you to make creative choices, which always brings some ambiguity.
Thankfully, one of the cures for uncertainty is an inspiration. I’ve collected low-fidelity and high-fidelity examples from some of our past projects at DePalma to provide you with some models of how we create wireframes.
Low-Fidelity Wireframe Examples
Onboarding and buying for an e-commerce mobile app wireframe example
Earlier this year, we designed the user experience for a mobile e-commerce app. The app allows independent retailers to sell their goods directly to consumers easily.
E-commerce has exploded over the past several years, and it’s one of the best environments for proving the ROI of experience design. In this industry, better UX translates directly to higher conversions and more revenue.
Here’s our wireframes for the onboarding workflow:
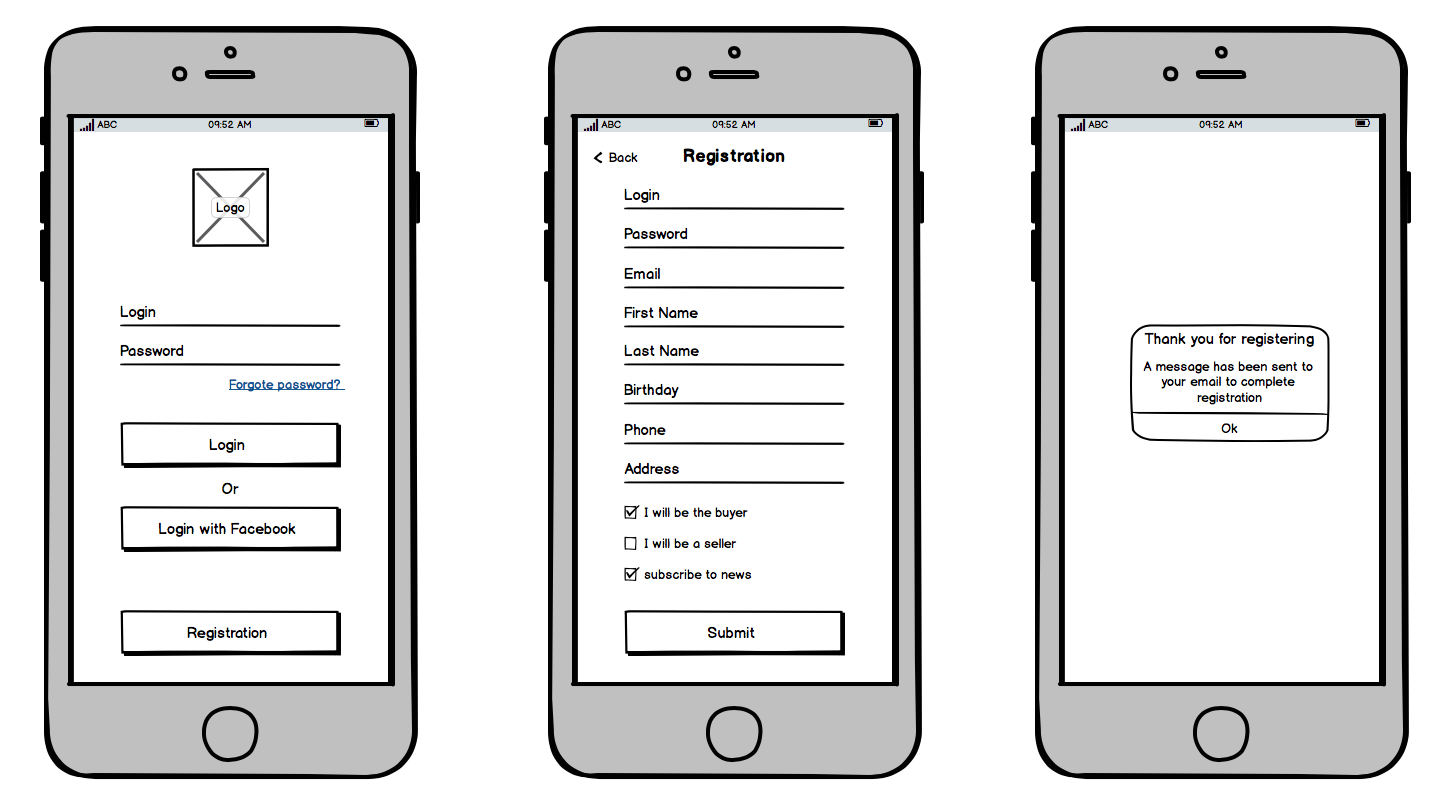
We kept this workflow relatively straightforward because the entire point of an optimized onboarding is to eliminate barriers for the user. We opted for one form to minimize the number of steps users had to take before they could use the app.
As you can see below the text input fields, a user can create two types of profiles: a buyer or a seller. Below, you’ll see the workflow buyers go through to view and purchase products:
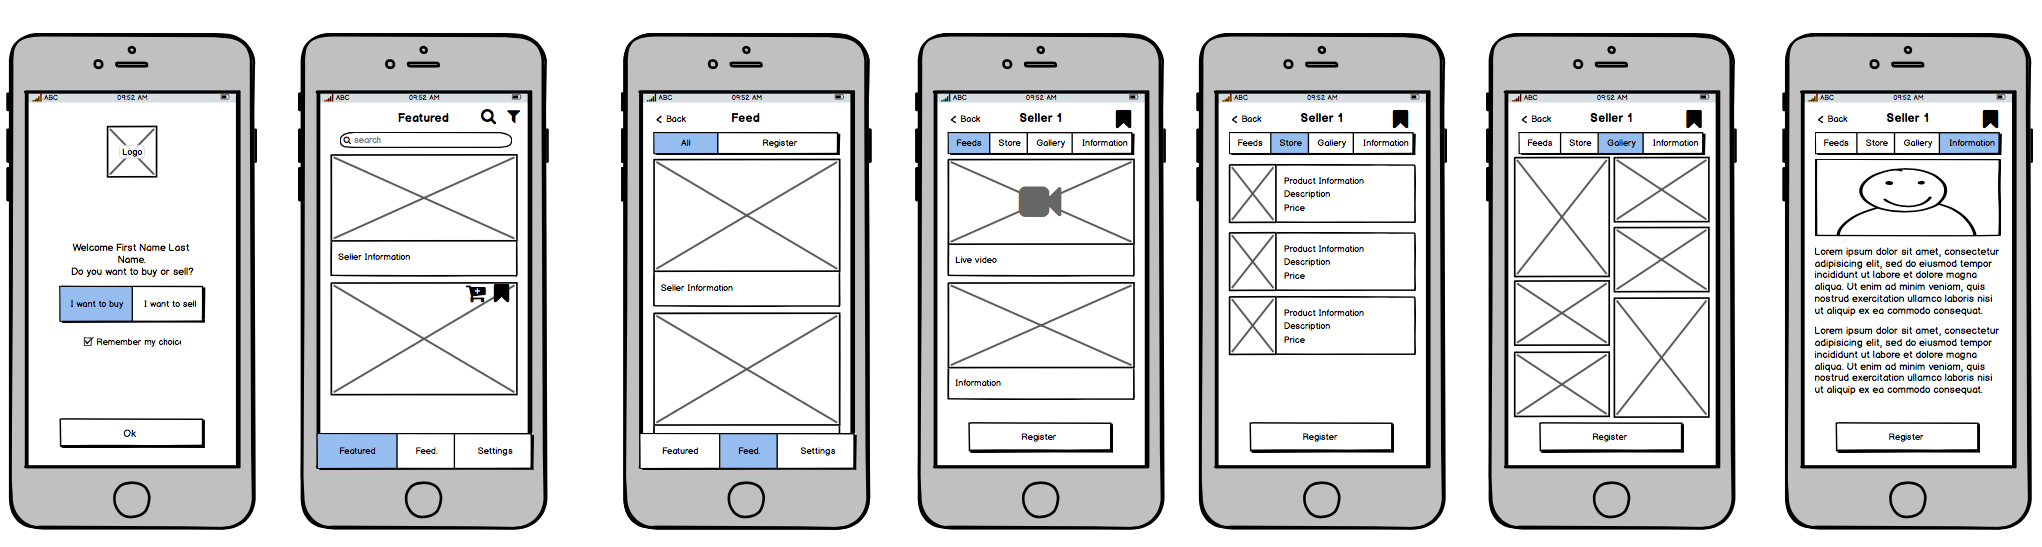
In case they make a mistake during registration, the opening screen asks first-time users to recommit to their choice of buyer or seller.
Once they choose a buyer, they’re immediately shown products on the next screen. These wireframes allow users to view products in featured and feed views. The wireframes map out each screen users can access throughout the process, including additional information about each seller.
Web application for janitorial services wireframe example
Small businesses are transitioning from running their business with paper documents to web and mobile applications. Things often go wrong when they adopt overcomplicated software that only partially meets their needs.
Sometimes it is better to have your solution designed and developed. And that’s exactly what we did for a janitorial services company.
Here’s a wireframe from their web application:
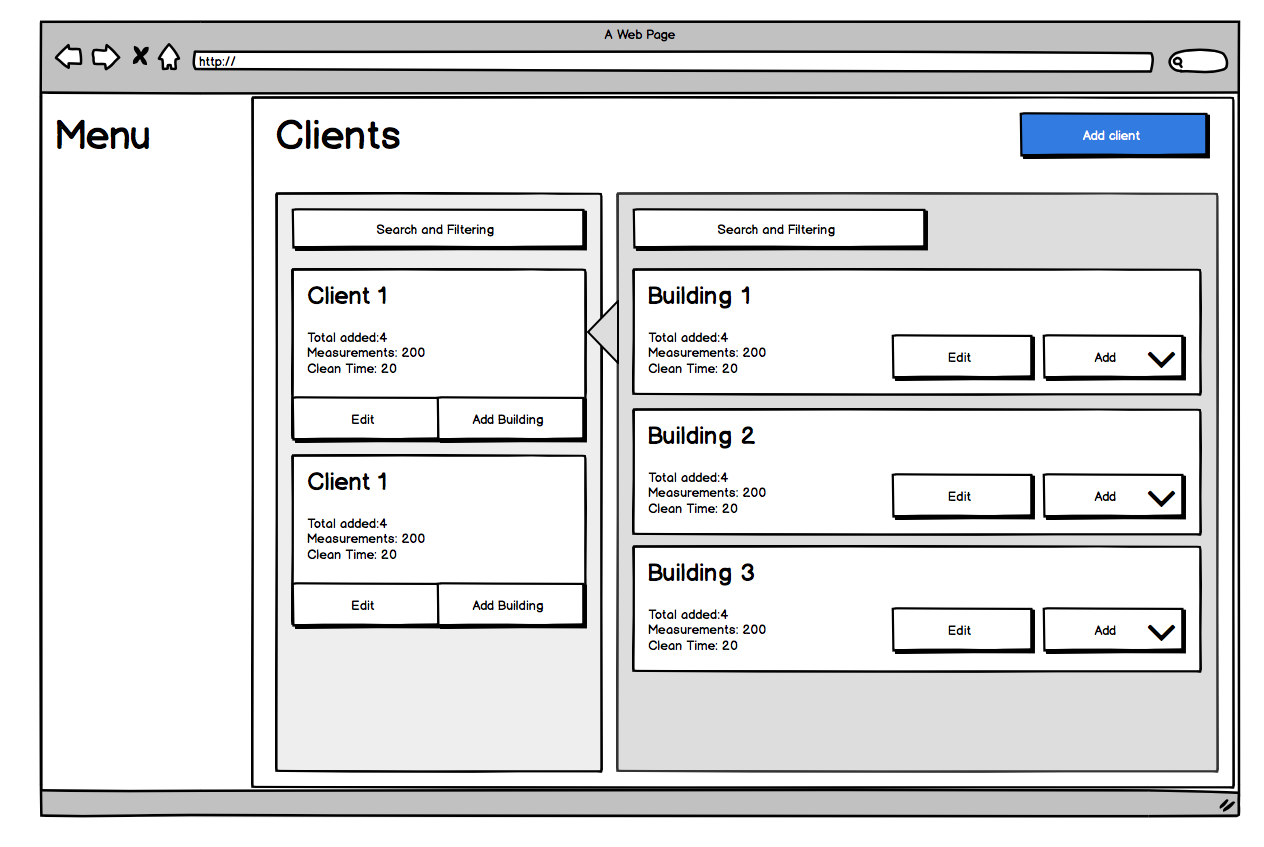
Our vision for this application was a lightweight design that made it dead simple for users to perform a few important actions.
Our research told us which data points users would need to add and update per client. This wireframe maps all of the primary tasks that our audience needed to accomplish daily.
Sometimes, less really is more.
Virtual assistant wireframe example
If you’ve been regularly reading any UX publication, I’m sure you’ve seen an article about designing voice user interfaces (VUIs). Natural language processing has finally reached a point where the technology can go mainstream.
Pioneering VUIs like Alexa, Google Home, and Fin only foreshadow a much larger market for voice technology. This technology's next milestone will empower users to complete increasingly complex tasks.
The enterprise environment is the perfect example. Enterprises are rife with proprietary, convoluted systems that users spend hours navigating each week.
What if things were simpler? We accepted That challenge when we designed an AI virtual assistant for the enterprise.
We had to answer many questions during this project, but one of the main ones was, “How do we let the user know what tasks they can perform?”
This wireframe shows how we solved it:
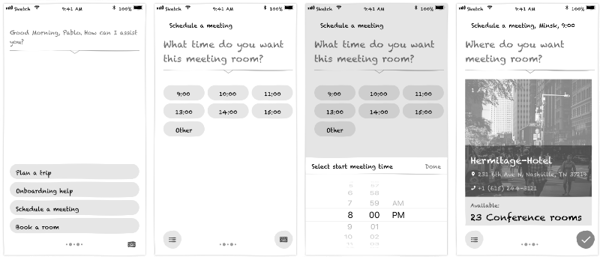
These wireframes visualize the workflow for booking a conference room with the AI assistant. Naturally, the user is going to have a lot of options to complete this task. Instead of having the AI vocalize every option, we added visual options that quickly showed the user their options.
This not only communicated the information faster but it also made the experience more adaptable to loud environments.
High-Fidelity Wireframes Examples
We always create our first round of wireframes in low-fidelity to stay agile. After the client stakeholders and end-users give us feedback, we add more detail to our nascent designs.
Performance dashboard for call center agents wireframe example
The modern call centers are a model of efficiency. There are metrics for average call time, resolution percentage, and volume of calls.
But like many industries that want to use data better to measure success, call centers struggle to manage and analyze all the information their agents generate daily.
This high-fidelity wireframe was part of our redesign for a call center analytics product:
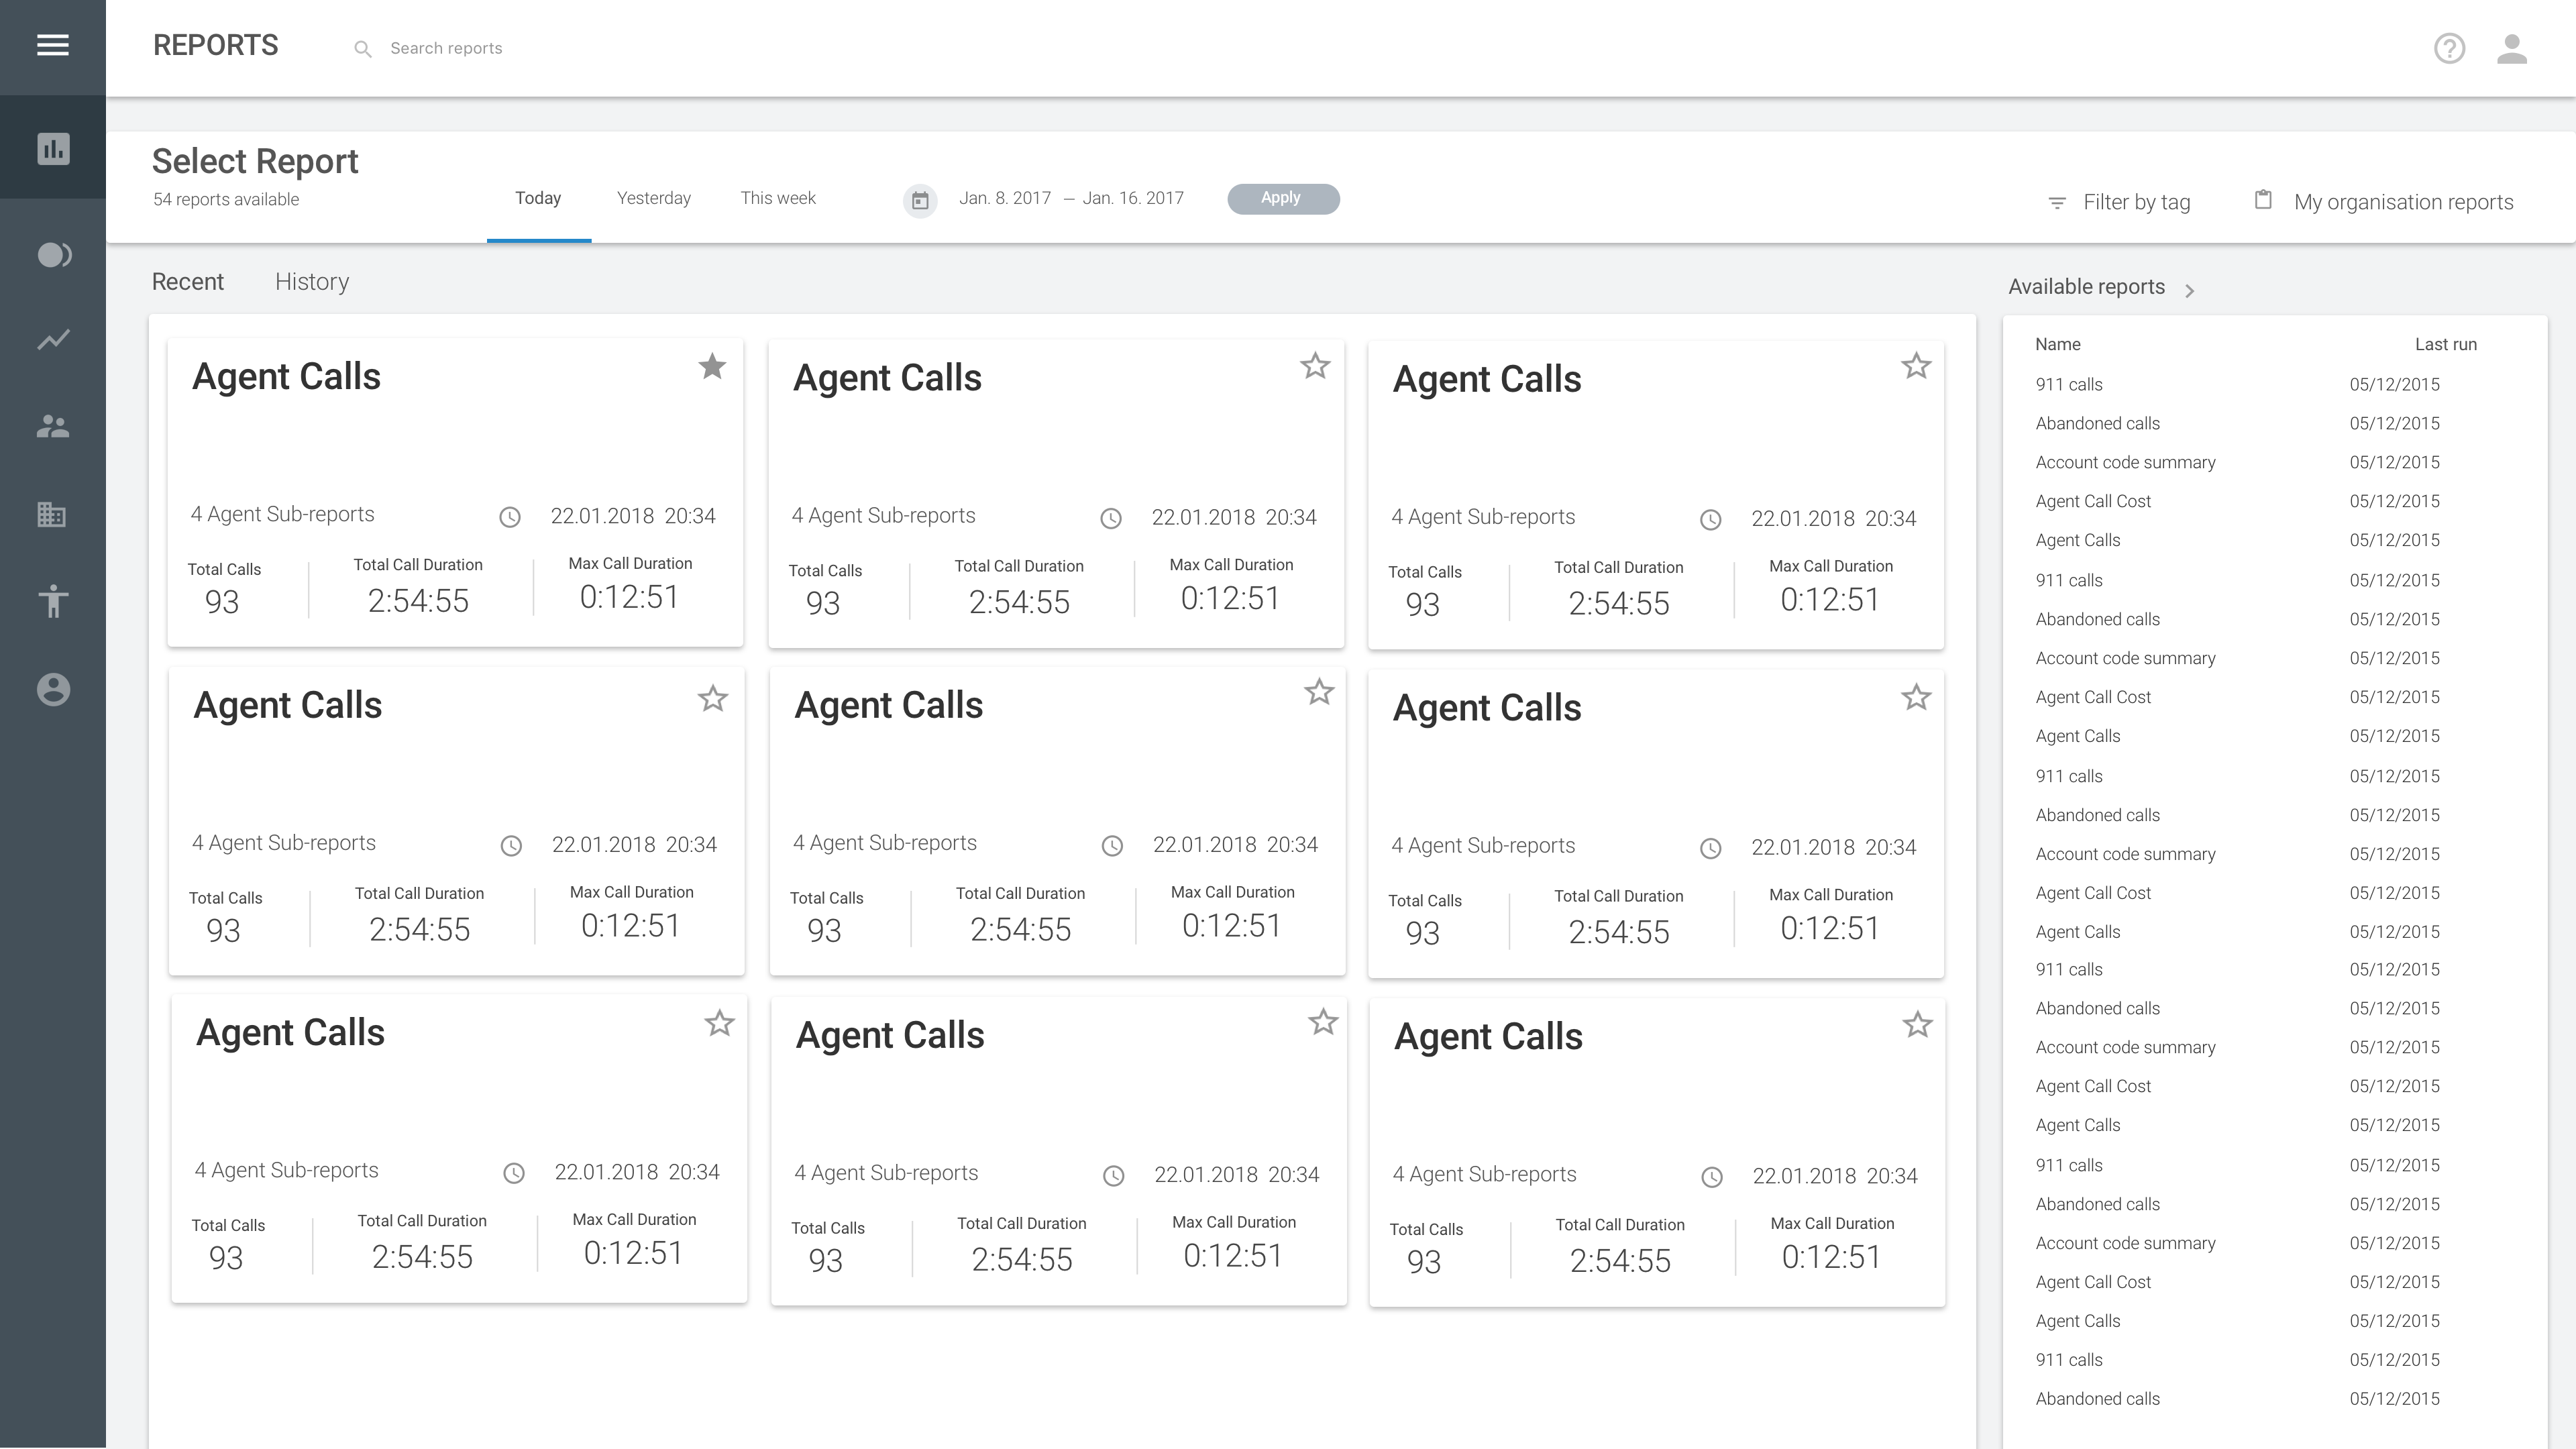
Although a lot of data is available to the user, only the most important metrics are emphasized on the dashboard. This reduces cognitive load and lets the user access the information they want at a glance.
Of course, the ability to dig deeper into the data is available, but this wireframe showcases our solution for making a flood of data manageable.
Elevating Healthcare Software with User-Centric Redesign
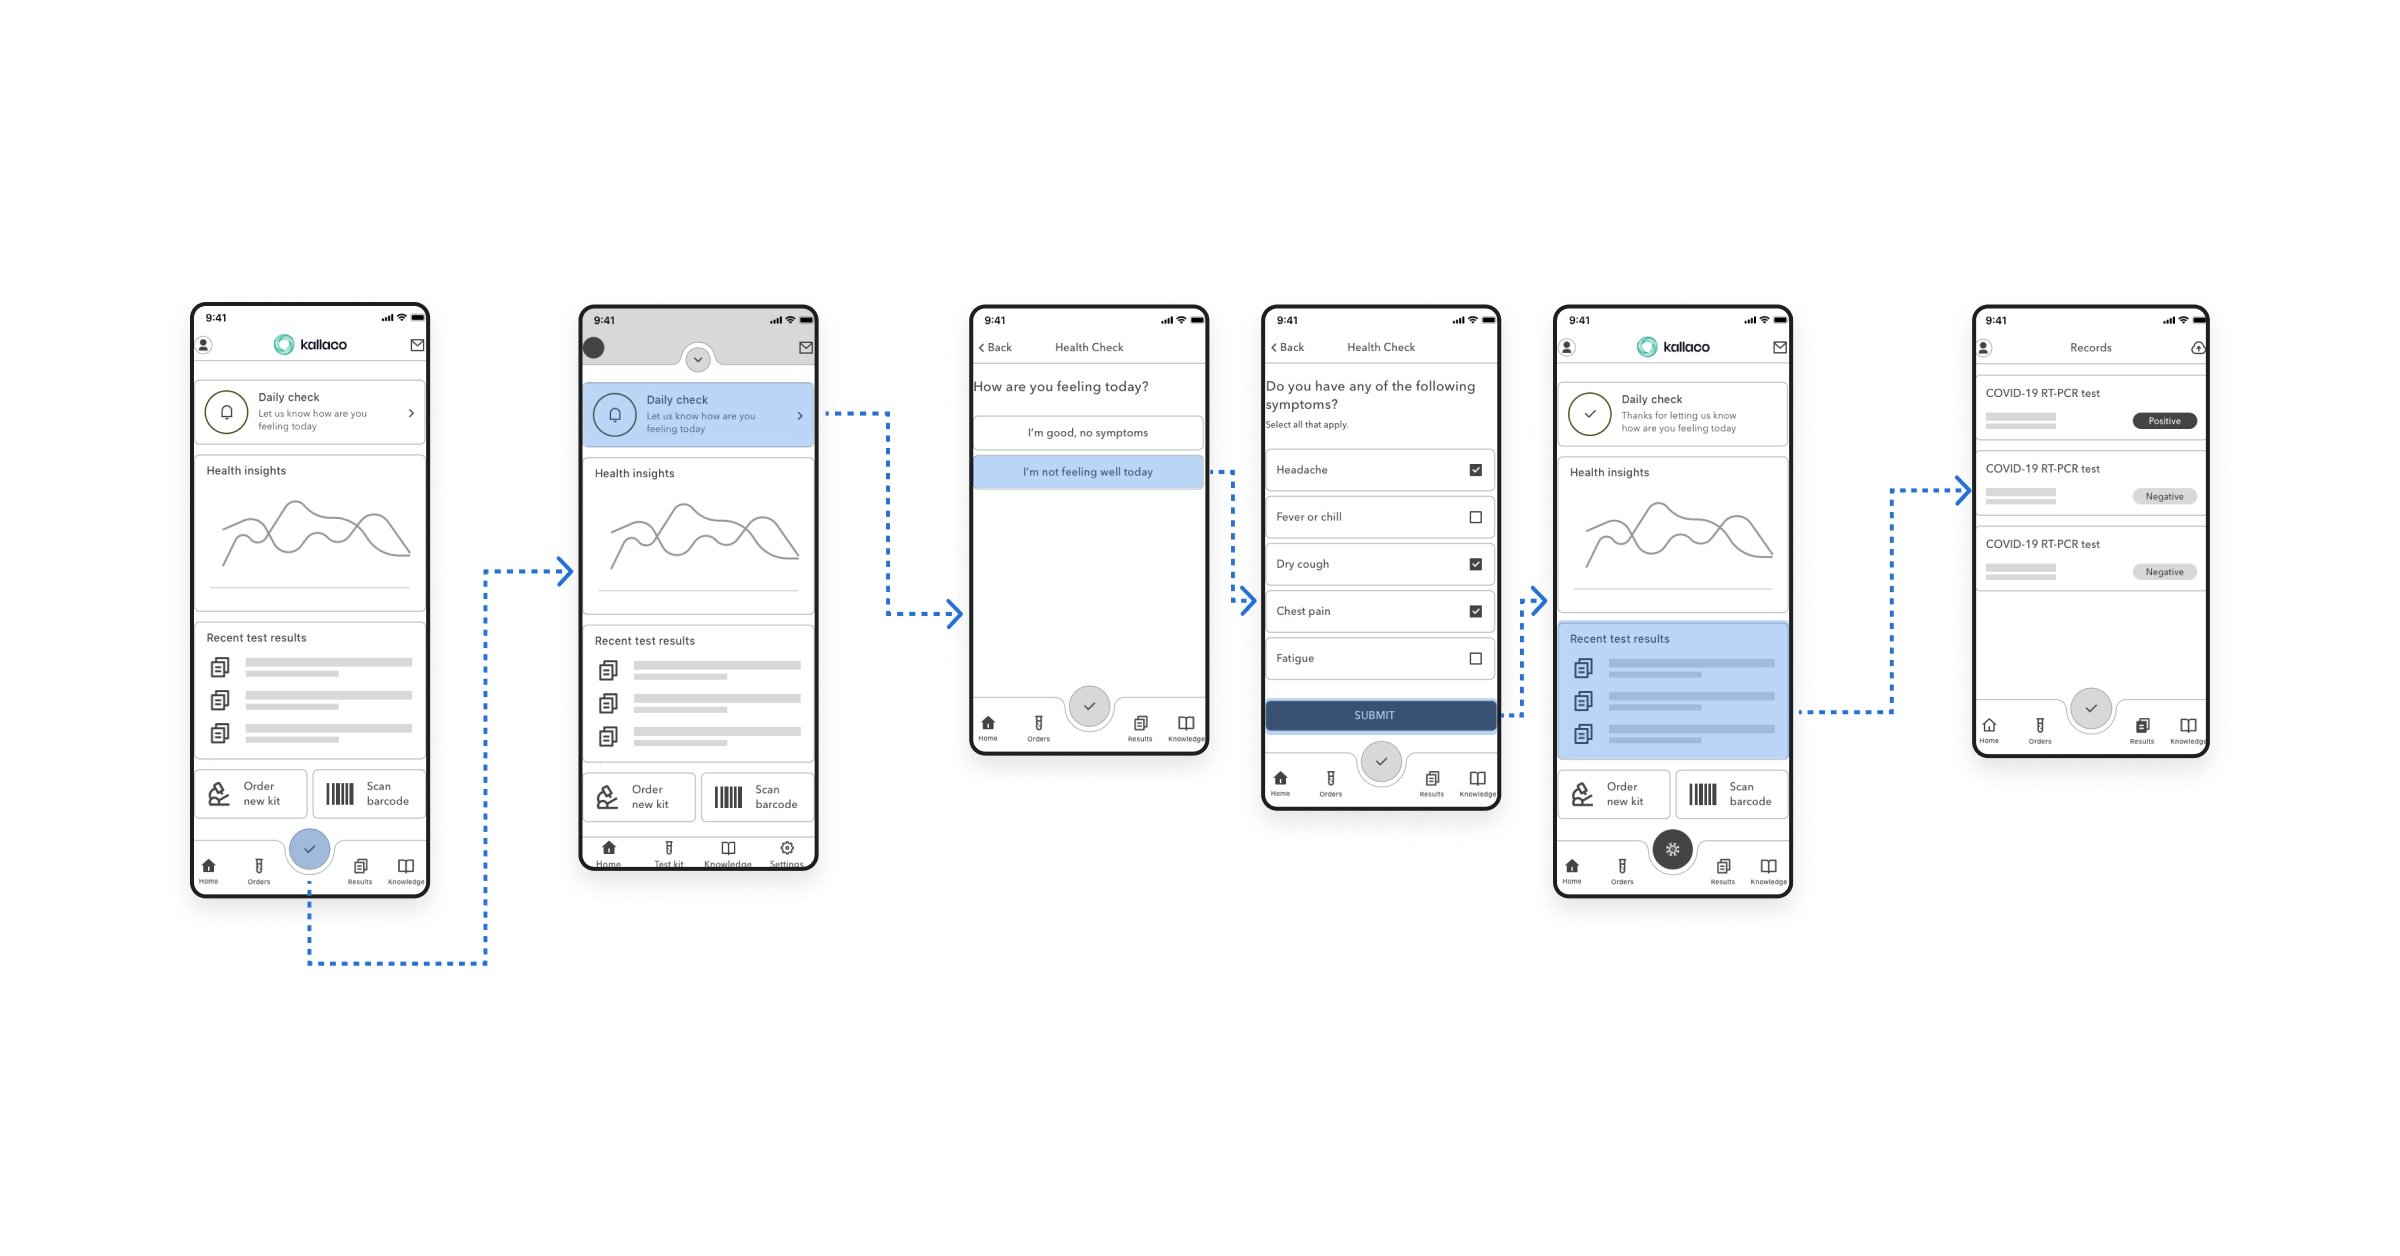
Kallaco, a healthcare software company, aimed to enhance its market position by providing users with an intuitive and feature-rich experience, prioritizing ease of use and comprehensive functionalities. To achieve this, they collaborated with DePalma Studios, known for their holistic approach to UI/UX design.
Below is a workflow to facilitate diagnosing COVID-19 symptoms and enabling an individual to be tested and find treatment.
CustomCook - Connecting Diners and Chefs
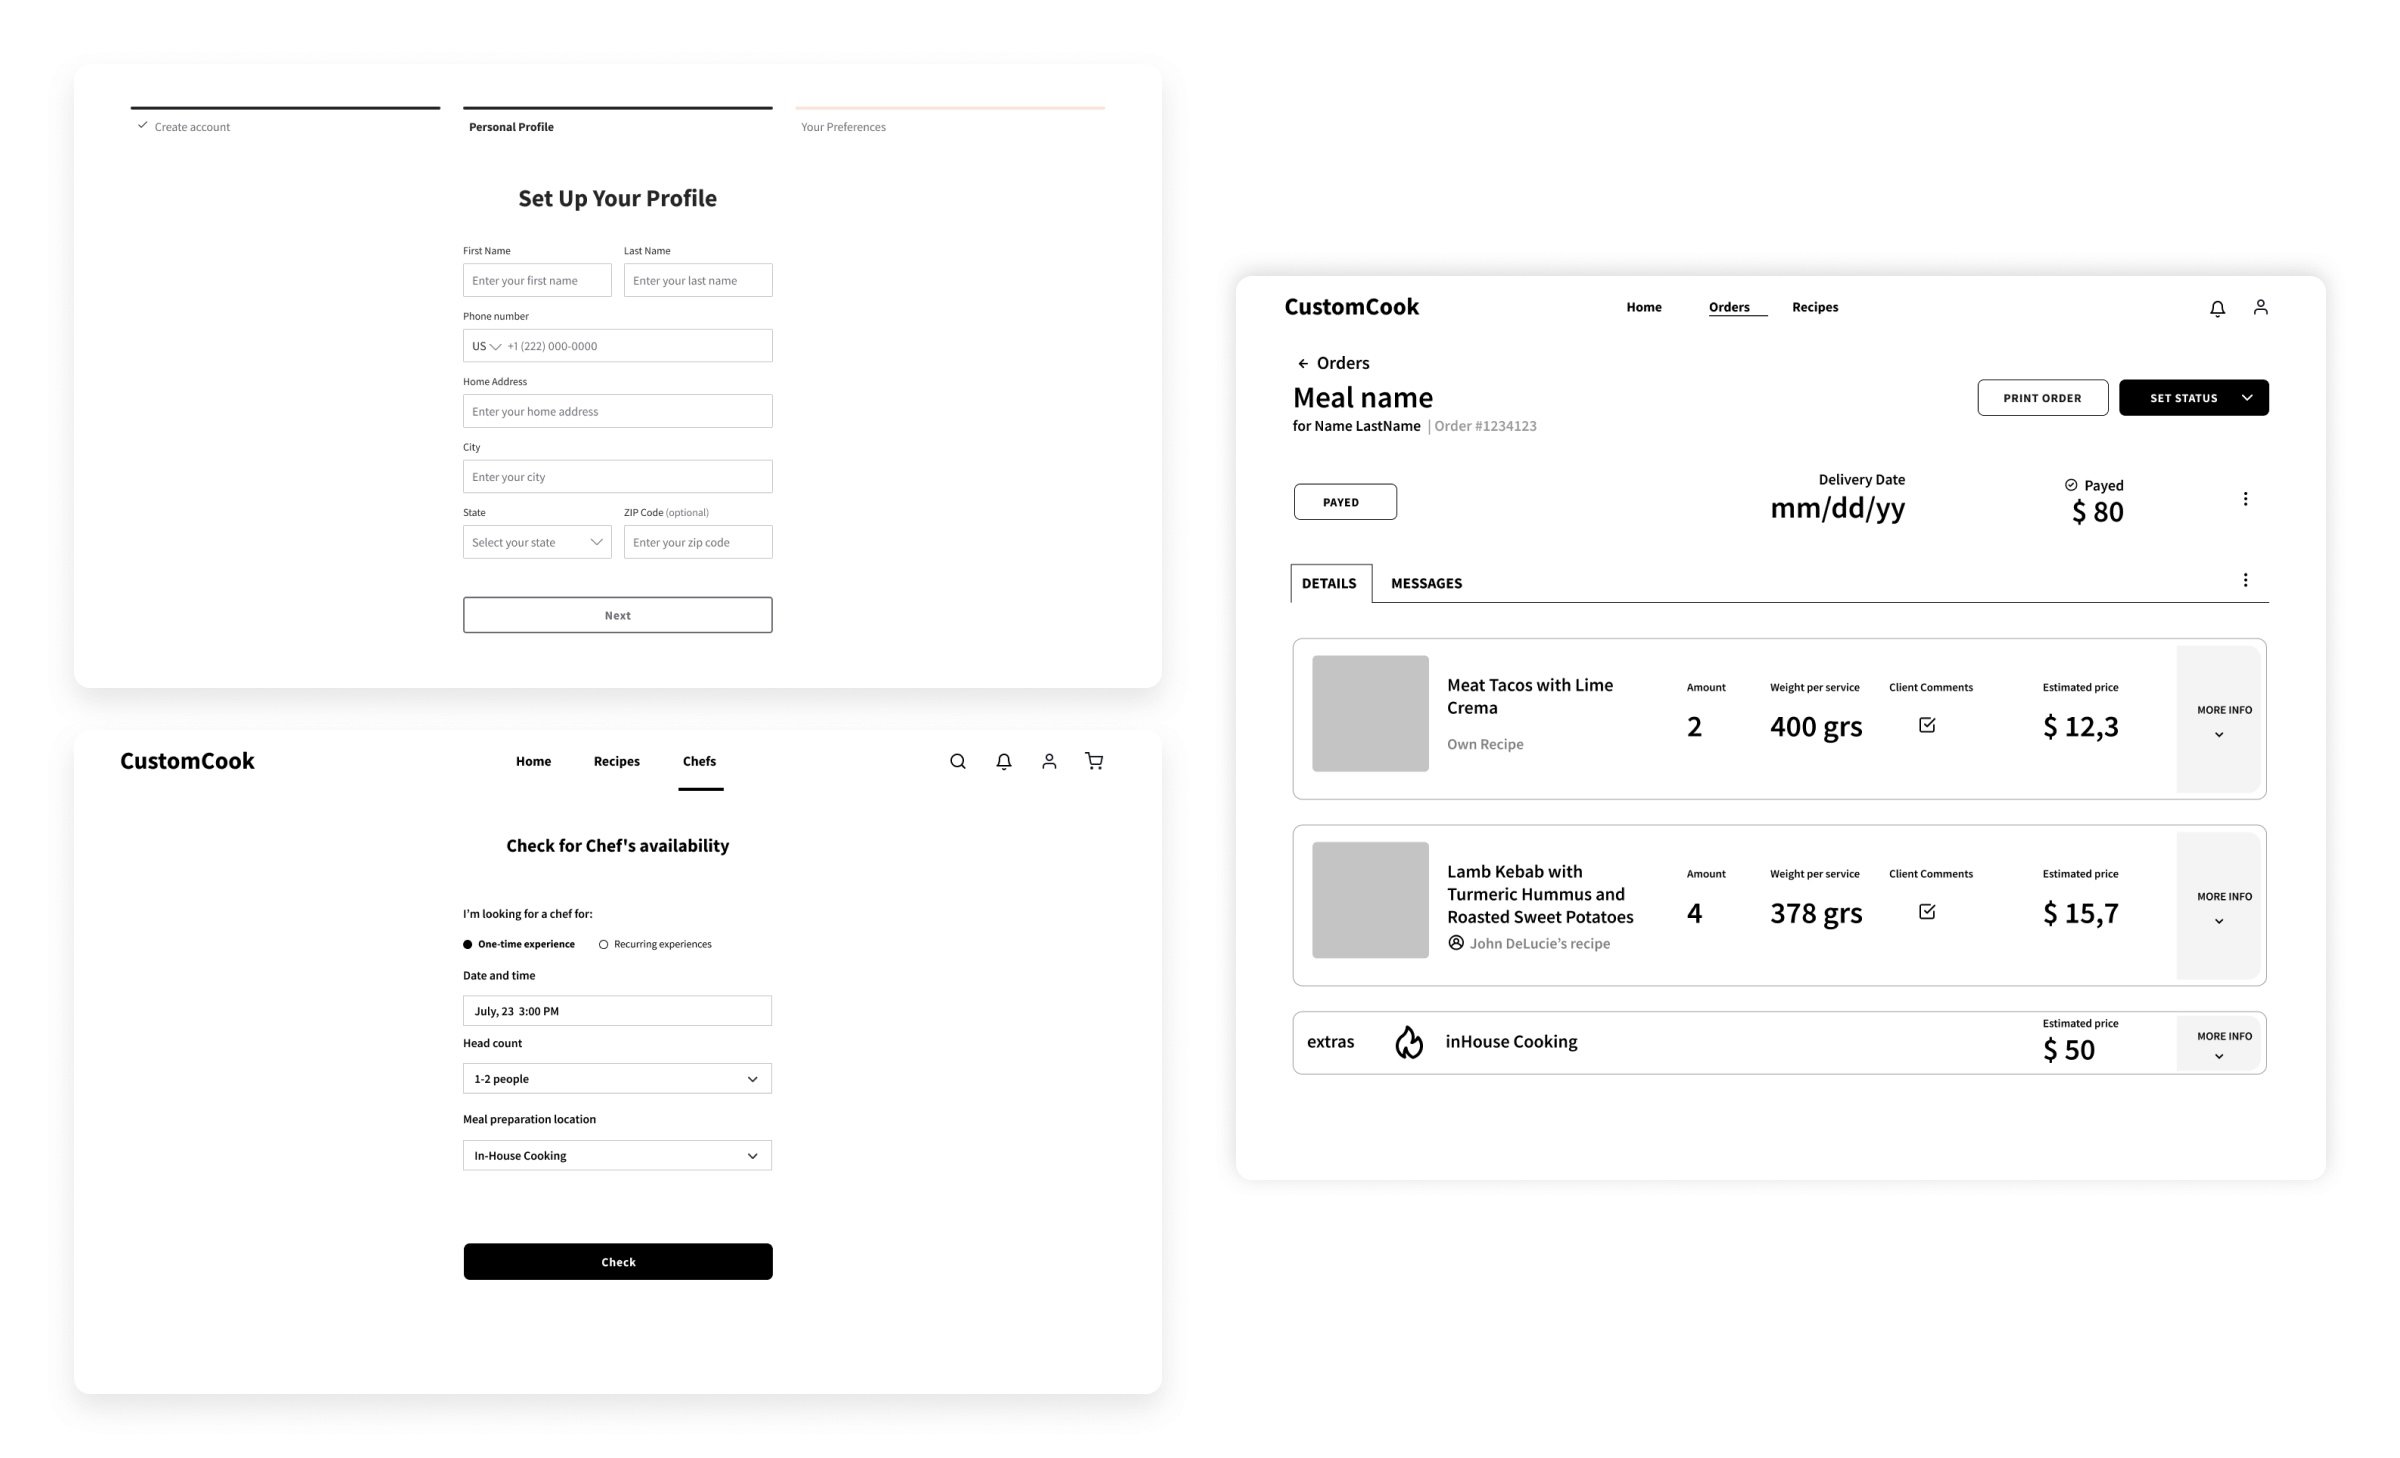
CustomCook, a national platform, aimed to seamlessly link diners with chefs and restaurants, creating a user-centric culinary solution. Challenges included optimizing user experience, mobile-first design, and addressing engineering complexities.
To attract investors, they developed a Minimum Viable Product (MVP) showcasing seamless connections between diners and chefs. Collaborative workshops and a Design Impact Workshop generated crucial insights, guiding feature prioritization and development.
Here are the wireframes from their web application:
Transforming the Music Industry with Tipify
A Nashville-based tech startup partnered with DePalma Studios to create Tipify, a groundbreaking platform focusing on performers' needs. Tipify is a search engine and digital payment platform elevating artists' visibility and enabling cashless tips.
This multifunctional application seamlessly connects audiences and entertainers, sets up anonymous banking connections, and automatically distributes tips. Users can send suggestions, rate performers, request songs, and share profiles all in one application.
Here’s our wireframes for the starting performance workflow:
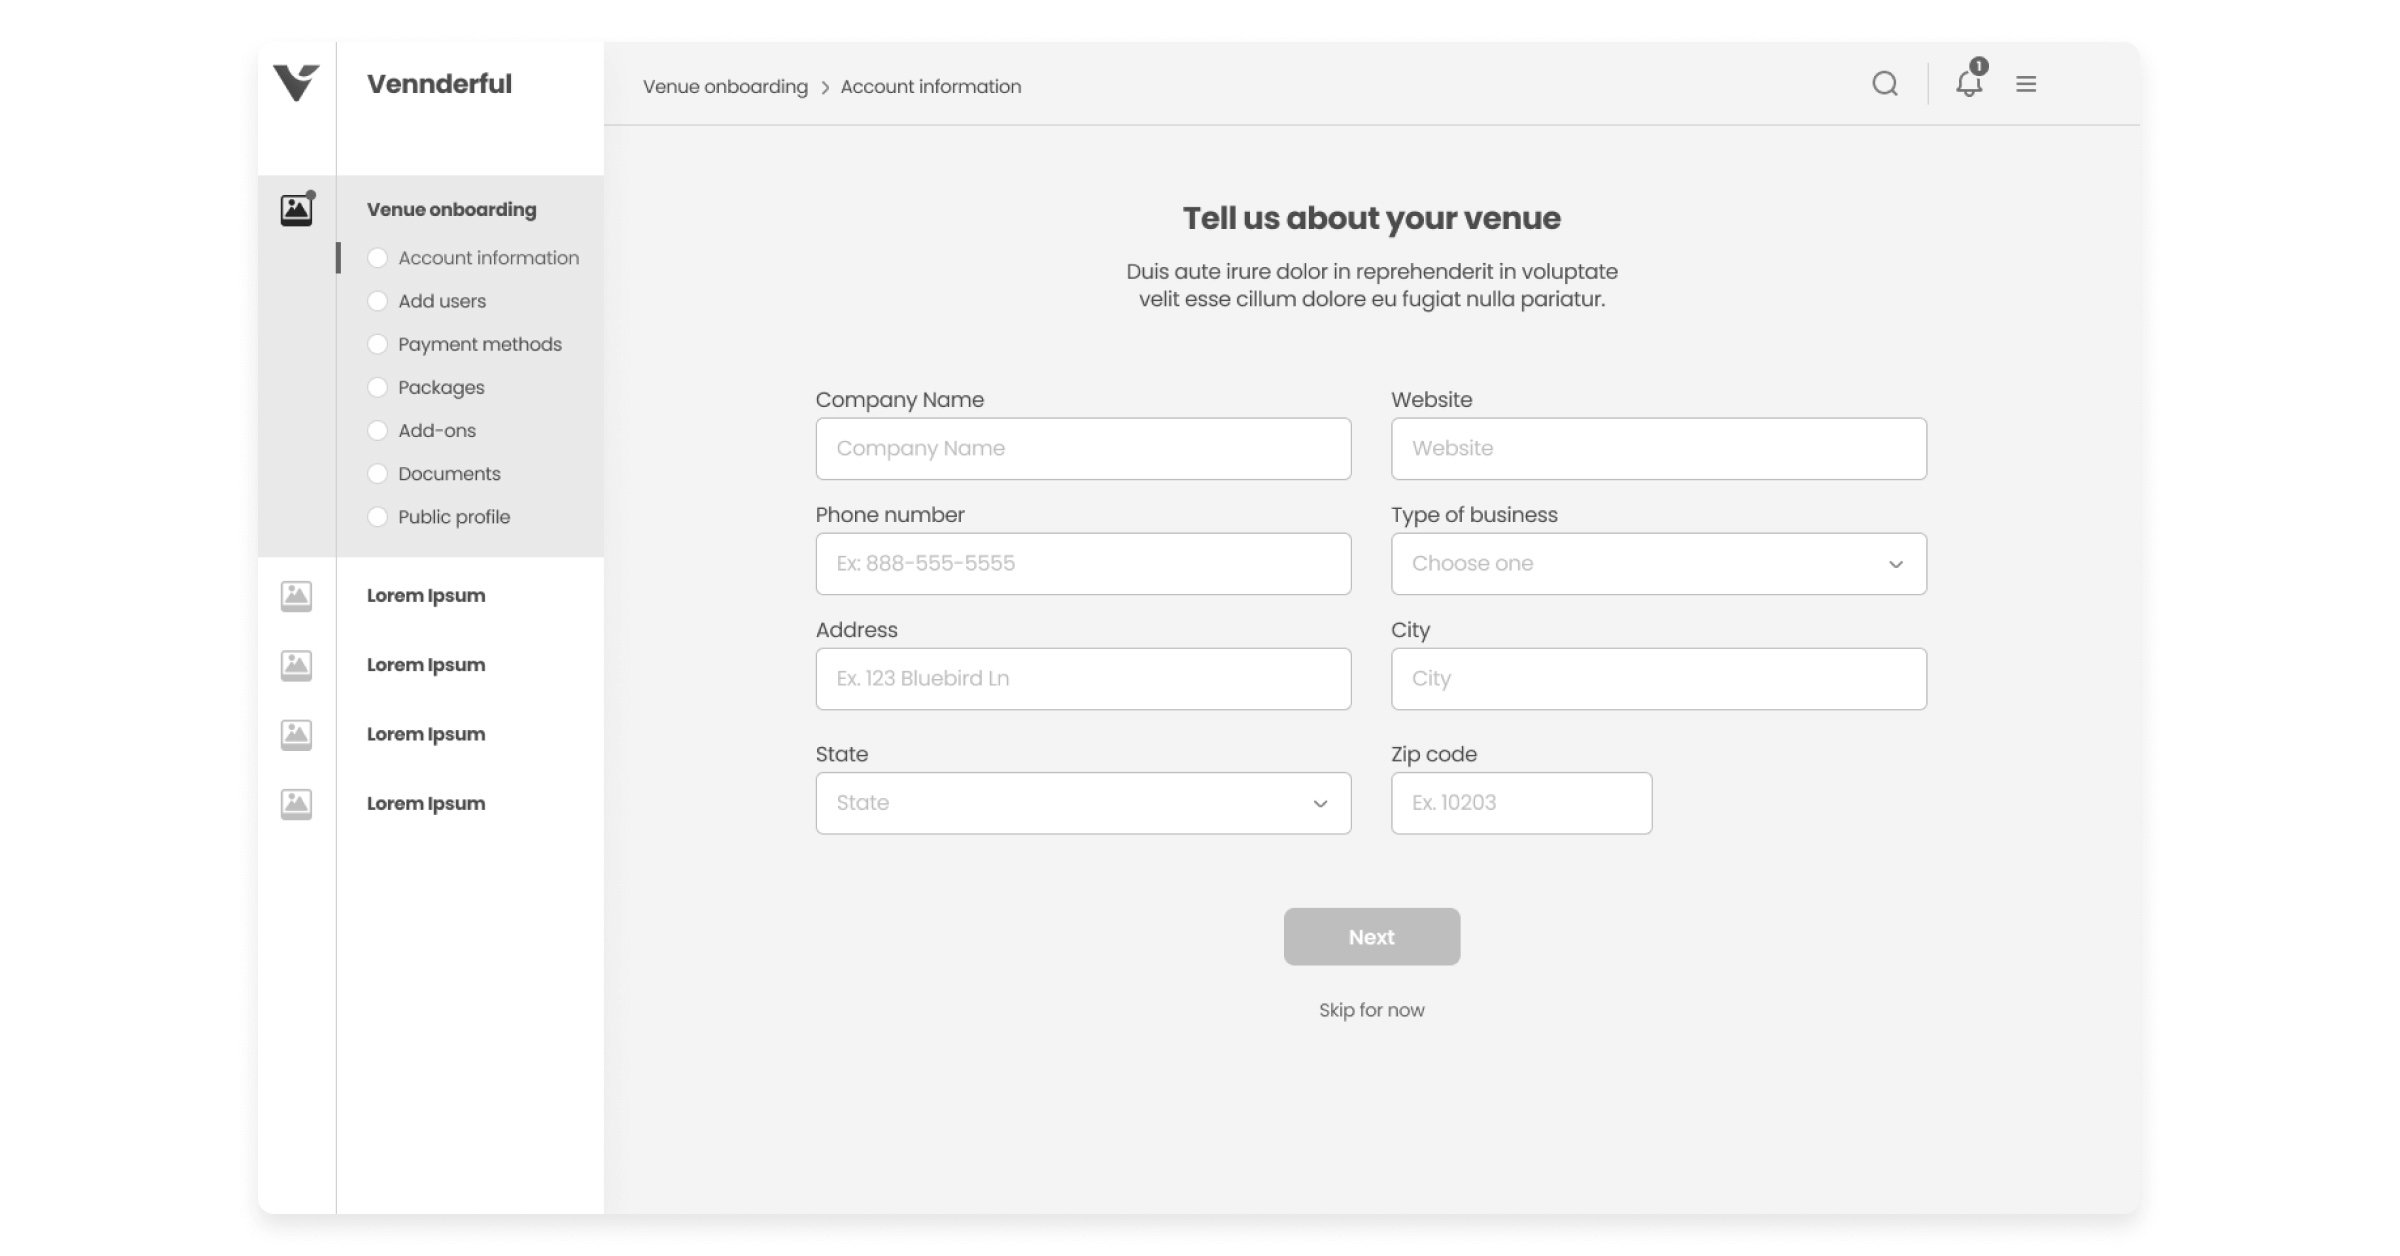
Vennderful Event Management
Vennderful, a transformative platform, unites venues, vendors, events, and customers seamlessly. The challenge: validate research, create user personas, and plan MVP development. Steps taken included organizing research, validating features, and exploring build options. Result: an efficient, user-centered Vennderful platform for streamlined event management.
Here’s an onboarding wireframe from their application:
***
Even the most experienced designers need inspiration from time to time. The next time at a blank screen, wondering what elements should go where, reference these wireframes. I’ll keep adding to them over time, so hopefully, our work will be a source of new ideas.
Share on Facebook
Share on Twitter